Batches are sets of tests grouped with a specific name and optional description. The name parameter lets you record the purpose of the tests, for example “Q4 feature preference testing”.Documentation Index
Fetch the complete documentation index at: https://docs.semilattice.ai/llms.txt
Use this file to discover all available pages before exploring further.
Basic usage
Create a test batch by passing an object to thebatch field in a tests create request. The create method’s tests field accepts both single test objects or a list of objects, but only if batch details are set will a batch get created.
Fetch a batch
Test responses always contain abatch field, but only if batch details were provided will a batch be created.
batch field. Grab this ID and then fetch the batch. The batch response will contain both the batch object and the batch’s tests.
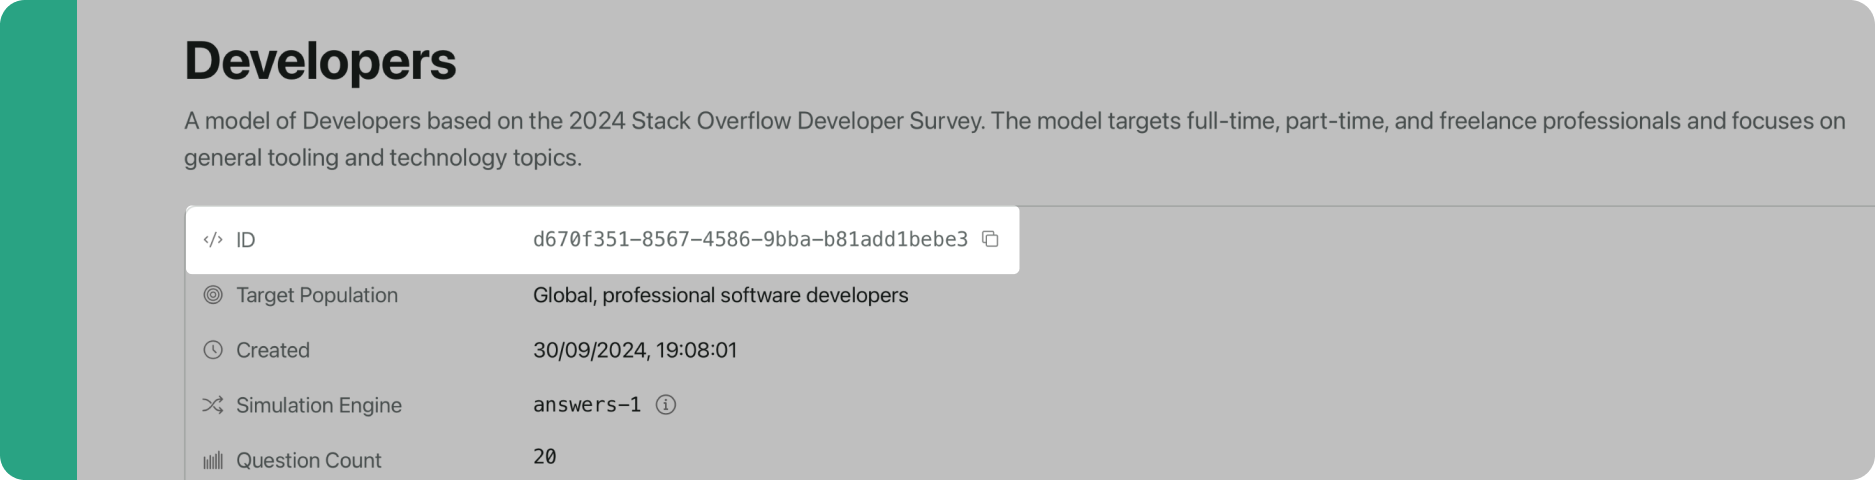
Choosing population models
require a specific population model ID. Call thelist method on populations to get a list of population models available for simulation.
Handling async batch results
Batch test simulations run asynchronously. A batch object has a status field which captures the overall test status of the batch. In addition, each individual test within the batch has its own status field which captures its individual test status. The initial batch status will be"Test Queued", and you need to poll for completion.
Initial response
Polling for results
The batch will progress through these statuses:Test Queued → Test Running → Tested (or potentially Test Failed). Tests typically take less than 20 seconds, so a batch should take N * ~20 seconds, where N is the number of tests in the batch.
Evaluation metrics
Once complete, batch results include aggregate evaluation metrics for all tests in the batch:Average Accuracy
- Field:
average_accuracy - Range: 0 to 1 (higher is better)
- Calculation: The mean absolute error (MAE) between the predicted and ground truth answer distributions for each question is calculated, averaged, and then subtracted from 1 to convert it from an error measure to a crude accuracy measure.
- Example: 0.8721
Average Squared Error
- Field:
average_squared_error - Range: 0 to 1 (lower is better)
- Calculation: The root mean squared error (RMSE) between the predicted and ground truth answer distributions for each question is calculated and then averaged.
- Example: 0.1607
Average Normalised Information Loss
- Field:
average_normalised_information_loss - Range: 0 to 1+ (lower is better)
- Calculation: The Kullback–Leibler (KL) divergence (also called relative entropy) between the predicted and ground truth answer distributions for each question is calculated, normalised to the number of answer options in the question, and then averaged.
- Example: 0.0063
Interpreting results
Based on all of our benchmarking to date, we have some hueristics on what “good” looks like.Good performance thresholds
- Average Accuracy: Above 0.85 (higher values indicate better accuracy)
- Average Squared Error: Below 0.18 (lower values indicate more consistent predictions)
- Average Normalised Information Loss: Below 0.1 (lower values indicate better distribution matching)
Benchmarking context
These thresholds come from extensive benchmarking work:| Metric | Good Threshold | Benchmarking Average | Benchmarking Range |
|---|---|---|---|
| Average Accuracy | Above 0.85 | 0.87 | 0.82 - 0.92 |
| Average Squared Error | Below 0.18 | 0.16 | 0.11 - 0.24 |
| Average Normalised Information Loss | Below 0.1 | 0.0569 | 0.0244 - 0.1006 |